Most commercial solar proposals you'll see in Utah have one thing in common: the ROI numbers are too good.
Not because the installers are lying. Because they're using assumptions that don't survive contact with how Rocky Mountain Power actually compensates exported solar in 2026. If you sign based on the proposal math and then find out two years later that your real payback is 8 years instead of 5, that's not a surprise. That's a sales trick.
Here's how to run the numbers yourself before you sign anything.
Net metering — the old rule where every kWh you exported back to the grid offset a kWh you pulled, at full retail rate — is closed to new Utah commercial customers. Customers grandfathered before November 15, 2017 keep it until 2036. Everyone else lives under net billing.
Net billing pays you for exports at roughly 5.7¢/kWh in summer and 4.2¢/kWh the rest of the year. Your retail commercial rate is typically 8-12¢/kWh.
That gap — the difference between what you save by consuming a solar kWh on-site versus what you earn by exporting it — is where most commercial ROI proposals quietly inflate the numbers.
If your installer's proposal assumes your exported energy is worth retail rate, the payback math is wrong. By a lot.
The size that maximizes ROI is rarely the size that maximizes nameplate capacity.
A system designed to flatten your bill — produce roughly what you consume during sunlight hours, with minimal export — returns dramatically more per dollar invested than a system designed to spin the meter backward across the whole year.
To find that size, you need to look at interval data, not just monthly kWh totals. A bakery that runs ovens at 5 AM has a different solar fit than an office building with 8-to-5 cooling load. Both might use 200,000 kWh/year. The right system size is different by 30-40% between them.
Most commercial proposals don't pull interval data. They size to nameplate. That's how you end up with a system that exports 35% of its production at half retail rate.
Here's the framework that survives reality. Run these numbers — or make sure your installer ran them — before you sign.
Step 1: Pull 12 months of interval data. Rocky Mountain Power provides this on request. Hourly consumption for a full year. Without it, every downstream number is guessing.
Step 2: Model on-site consumption vs. export. A properly sized commercial system in Utah should consume 75-90% of its production on-site. If your proposal shows 50/50 or worse, the system is oversized for your load profile.
Step 3: Calculate annual savings correctly.
Annual savings =
  (kWh consumed on-site × your retail rate)
+ (kWh exported × net billing rate, ~4-6¢)
− (any demand charges that solar doesn't reduce)
That last line catches a lot of owners. Solar reduces energy charges (¢/kWh). It often does not meaningfully reduce demand charges (the $/kW peak fee on commercial bills) unless paired with battery storage. If demand charges are 30% of your bill, solar alone is solving 70% of the problem.
Step 4: Apply the full incentive stack against gross cost.
For a $500,000 commercial system in Utah, the after-incentive math:
Gross system cost                $500,000
Federal ITC (30%)                −$150,000
Utah RESTC (10%, capped)          −$50,000
MACRS depreciation (5-yr)*        ~−$85,000
─────────────────────────────────────────
Effective net cost                ~$215,000
*MACRS savings depend on your tax position; figure assumes ~21% blended marginal rate.
Step 5: Calculate payback period.
Payback (years) = Effective net cost ÷ Annual savings
A well-sized commercial system in Utah, at current rates, with the full federal + state + MACRS stack, typically pays back in 4-7 years. Under that range, double-check the assumptions. Over that range, the system is probably oversized or the rate environment doesn't fit.
If a Utah commercial solar proposal doesn't include these three lines, ask why before you sign.
1. On-site consumption ratio. "Of total annual production, X% will be consumed on-site at retail rate, Y% exported at net billing rate." Not a single weighted-average savings number that hides the export discount.
2. Demand charge analysis. "Of your current $X/month bill, $Y is energy charges (which solar reduces) and $Z is demand charges (which solar partially reduces / does not reduce)." This separates real savings from optimistic savings.
3. Year-by-year cash flow, not just total payback. Year 1 should show the federal ITC hitting your taxes. MACRS savings spread across years 1-6. Net cash position by year. If the proposal shows one big "payback in 5.2 years" number with no annual breakdown, the math is hiding something.
The 30% federal ITC has a hard deadline: projects that don't begin construction by July 4, 2026 must be operational by December 31, 2027 or the credit is gone. (Full breakdown of the safe harbor rules here.)
That deadline doesn't change the ROI math. It changes the consequence of bad ROI math. A proposal that's slightly optimistic at today's 30% credit might still pencil. The same proposal at 0% credit doesn't.
If you're going to commit capital to commercial solar, the best 9 weeks to do it are the next 9 — and the best way to commit is to numbers you've actually pressure-tested.
We'll do the interval data pull, the on-site consumption model, the demand charge analysis, and the after-incentive cash flow — for free, in 30 minutes on the phone. If the math doesn't work for your building, we'll tell you. We've turned down jobs.
If the math does work, you'll have a number you can take to your CFO that survives audit.
Schedule your free safe harbor assessment →
Intermountain Wind and Solar is a Centerville, Utah commercial solar contractor serving Utah and Idaho since 2008. NABCEP-certified design, in-house engineering, BBB A+. We sell what we use — our office runs on solar.


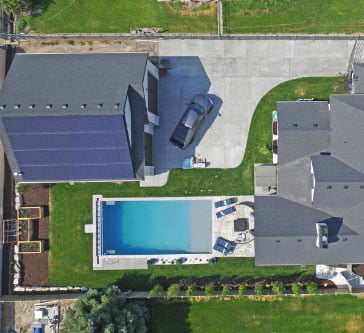
"All of the photos on this website are of real projects that Intermountain Wind & Solar has designed and installed.
We are proud to show off and stand behind our work."